- v50 information can now be added to pages in the main namespace. v0.47 information can still be found in the DF2014 namespace. See here for more details on the new versioning policy.
- Use this page to report any issues related to the migration.
Difference between revisions of "40d:Z-axis"
m (Added to Category:Guides, and added See Also heading with links. This page needs pictures showing the visual differences between height levels) |
(→See also: fixed a link) |
||
| Line 25: | Line 25: | ||
== See also == | == See also == | ||
* [[Export local image]] (map export) | * [[Export local image]] (map export) | ||
| − | * [http://mkv25.net DF Map Archive] - a community site for sharing maps, lets visitors browse vertically through z-levels in exported maps | + | * [http://mkv25.net/dfma DF Map Archive] - a community site for sharing maps, lets visitors browse vertically through z-levels in exported maps |
Revision as of 18:56, 19 November 2007
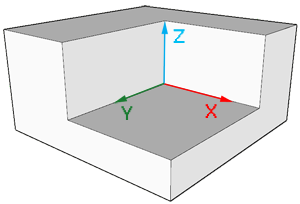
The third axis is known in math as the z-axis.
It's easy to think of a graph with an x-axis and a y-axis, right?
In the Dwarf Fortress map view, travelling east or west moves you along the x-axis, and travelling north or south moves you along the y-axis. Travelling higher or deeper moves you along the z-axis.
The z-axis, as you can see, is perpendicular to both the x-axis and the y-axis to create a 3D coordinate system, which is what Dwarf Fortress is based in.
Thus, objects described with only two axes are two-dimensional, whilst objects with depth measured along the z-axis are three-dimensional.
The z-axis is believed to be in part of the game engine that calculates accuracy of weapons based on where dwarves are, how missiles fly, and other similar considerations.[Verify]
To move up and down, use < and > (which are shift, and shift.).
In fortress mode
In fortress mode, the right-most column shows your location on the z-axis. Blue is above ground, brown is below ground, and yellow shows the current level. This reflects the elevation profile for the spot the cursor is currently over. The number at the top shows how many levels above or below the surface the spot currently is. The number at the bottom is the total elevation of the current level.
See also
- Export local image (map export)
- DF Map Archive - a community site for sharing maps, lets visitors browse vertically through z-levels in exported maps
